This is the second part of two posts about using ggplot to visualize geometric transformations in the complex plane.
Inversions
For this post we’ll focus on inversions, having already covered rotations, translations, and reflections. An inversion can be thought of as a reflection across a circle, the the inside of the circle gets flipped to fill the plane outside the circle and the outside is flipped into the circle. This is a more complicated transformation, both to visualize and to perform mathematically, but is essential to geometry.
The Math
Since an inversion involves a circle, we’ll need a center \(z_0 = x_0+iy_0\) and a radius \(r\). Any point \(z\) that’s within \(r\) of \(z_0\) must be moved to a point further than \(r\) from \(z_0\), and should lie on a line connected \(z\) and \(z_0\). This is accomplished via the formula: \[ inv(z) = \frac{r^2}{\overline{z-z_0}}+z_0 \]
Since dividing by a complex number is not really done, we can turn this formula into: \[ inv(z) = \frac{r^2(z-z_0)}{|z-z_0|^2}+z_0 \] This may not look simpler, but it will be easier to write code for since it just multiples \(z-z_0\) by the square of the ratio of the radius to the distance from \(z\) to \(z_0\), then translates by \(z_0\). Since the ratio of distances is real, this means we’re just translating \(z_0\) to the origin, dilating by the square of distance ratio, then translating back to \(z_0\). Do we really even need new code? Not really.
The code
We use the translation and rotation functions from the previous post:
translateR <- function(x,y,tx,ty){return (x+tx)}
translateI <- function(x,y,tx,ty){return (y+ty)}
rotateR <- function(x,y,rx,ry){return (x*rx-y*ry)}
rotateI <- function(x,y,rx,ry){return (x*ry+y*rx)}
Our inversion function will apply these, and work well when handed a data.frame of points.
inversion <- function(x,y,x0,y0,r){
  #set-up a data.frame to be returned
  pt <- data.frame(x=x, y=y)
  #translate z_0 to the origin
  pt$x <-translateR(x,y,-x0,-y0)
  pt$y <-translateI(x,y,-x0,-y0)
  #dilate
  distRatio <- r^2/((x-x0)^2+(y-y0)^2)
  pt[,1:2] <- c(rotateR(pt$x,pt$y,distRatio,0),
          rotateI(pt$x,pt$y,distRatio,0))
  #translate back
  pt[,1:2] <- c(translateR(pt$x,pt$y,x0,y0),
          translateI(pt$x,pt$y,x0,y0))
  return(pt)
}
Graphs of Inversion
Let’s start by re-using our rectangle from previously and doing an inversion across the circle centered at the origin with radius 2.
rectangle <- data.frame(x = c(rep(seq(from=0, to=2, by=.1),2), rep(0,11),rep(2,11)),
                  y=c(rep(0,21),rep(1,21),rep(seq(0,1,by=.1),2)))
rectangle$code <- "Original"

invRect <- data.frame(x=rectangle$x, y=rectangle$y)

invRect[,1:2]<- inversion(rectangle$x, rectangle$y, 0,0,2)
invRect$code <- "Inverted"

library(ggplot2)
library(dplyr, quietly = TRUE)

rbind.data.frame(rectangle, invRect) %>%
  ggplot(aes(x=x,y=y, col=code)) + geom_point(size=1) + xlim(c(-2,12)) + ylim(c(-2,12))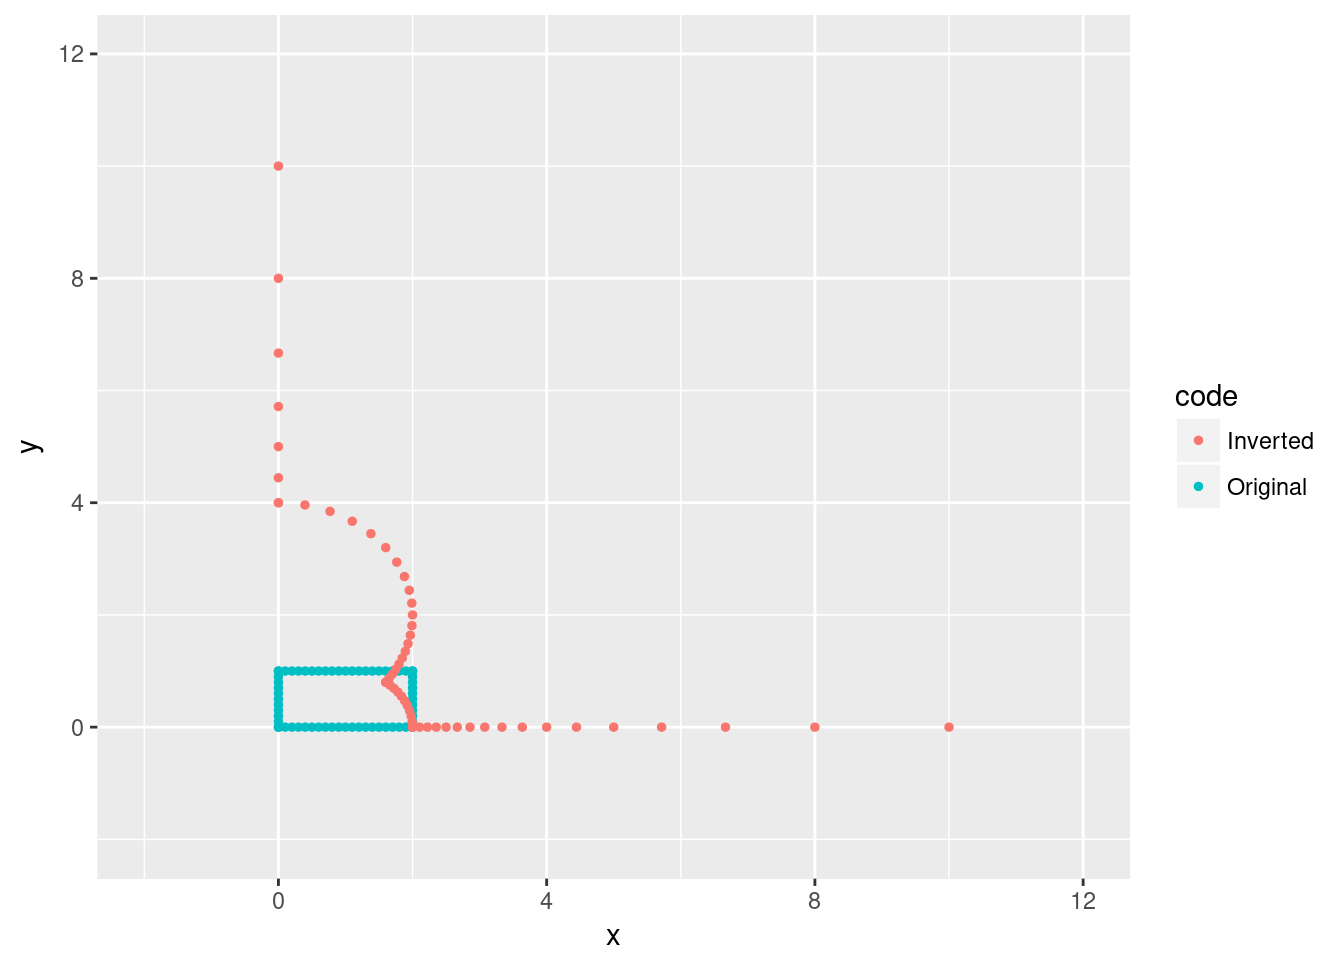
Notice how lines through the center of the circle remain lines. The lower right corner, which is on the circle, if fixed, but the center of the circle is sent to the outer reaches of the plane. The upper right corner, which was outside the circle, gets flipped inside the circle.
Let’s do another example, this time we’ll use a circle centered at \((-1,-1)\) with radius 4.
invRect <- data.frame(x=rectangle$x, y=rectangle$y)
invRect[,1:2]<- inversion(rectangle$x, rectangle$y, -1,-1,4)
invRect$code <- "Inverted"
rbind.data.frame(rectangle, invRect) %>%
ggplot(aes(x=x,y=y, col=code)) + geom_point(size=1) + xlim(c(-2,12)) + ylim(c(-2,12))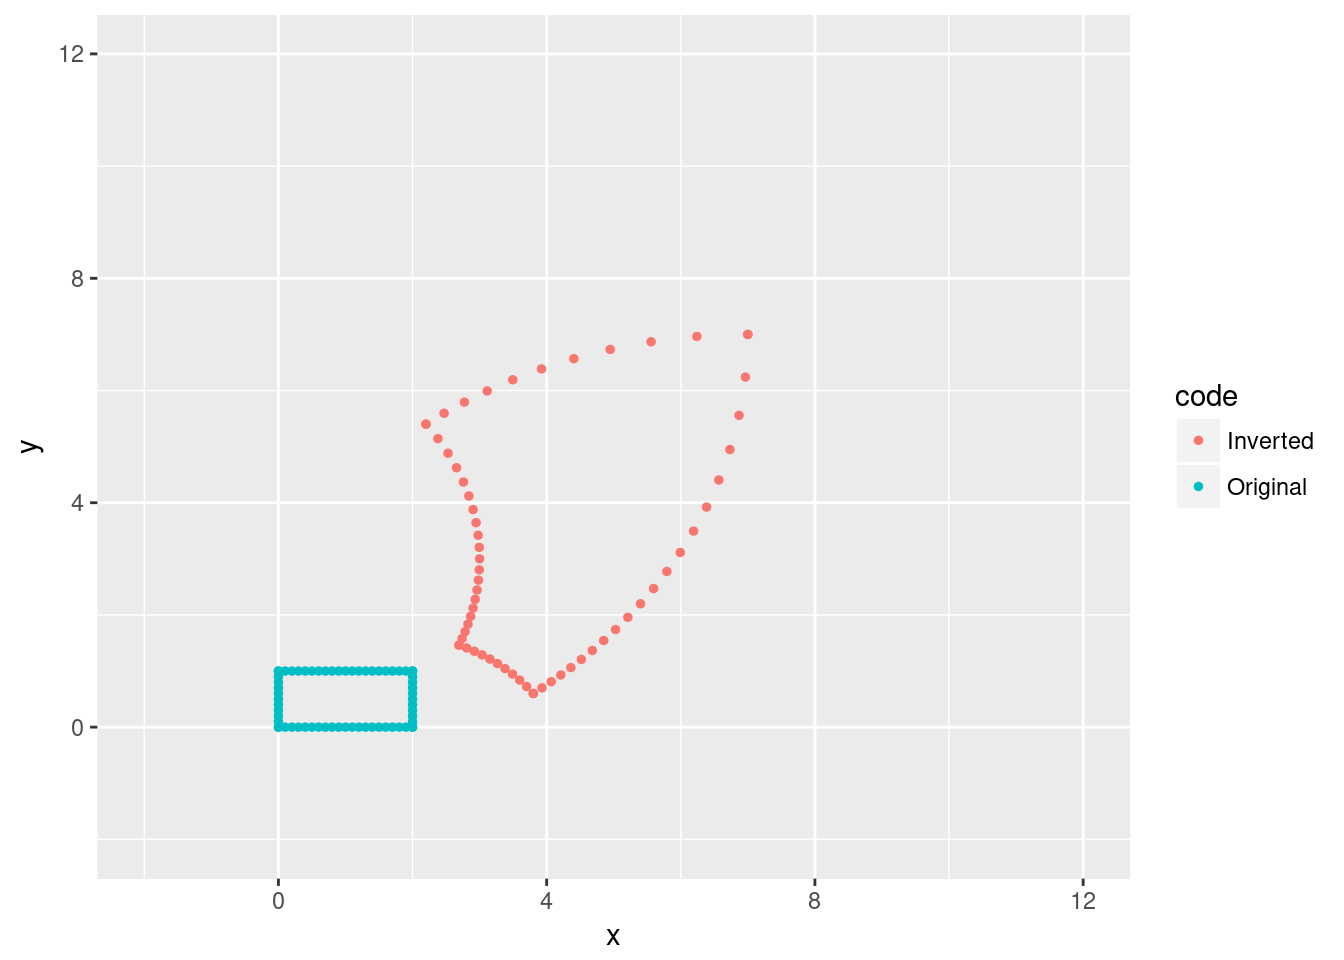 What if we take a rectangle outside of the circle and invert?
invRect <- data.frame(x=rectangle$x, y=rectangle$y)
invRect[,1:2]<- inversion(rectangle$x, rectangle$y, 5,0,2)
invRect$code <- "Inverted"
rbind.data.frame(rectangle, invRect) %>%
ggplot(aes(x=x,y=y, col=code)) + geom_point(size=1) + xlim(c(-2,7)) + ylim(c(-2,3))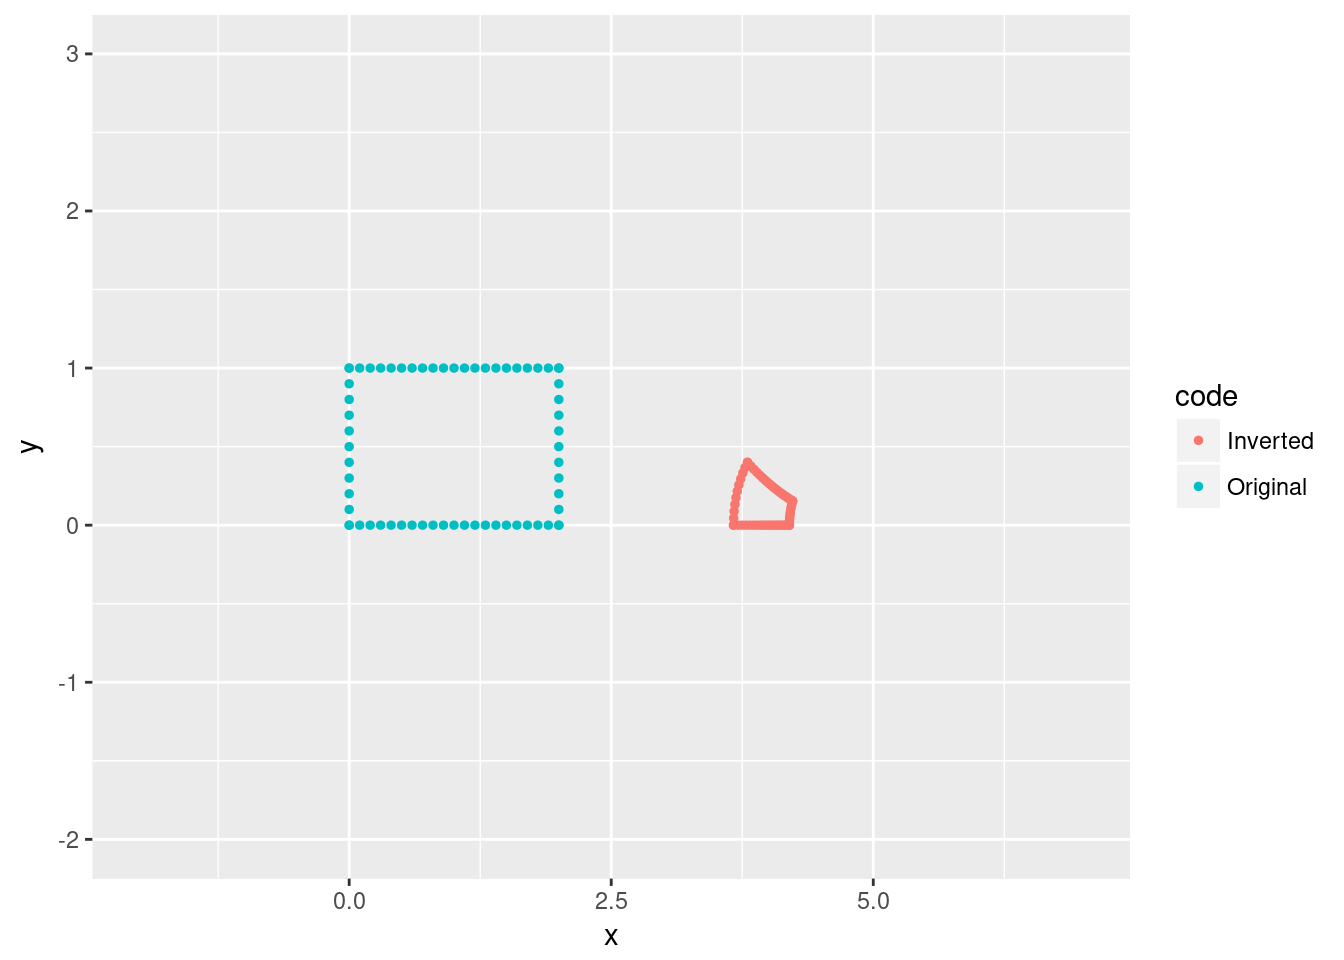 Inversions aren’t a simple to predict as rotations and translations. I encourage you to experiment a bit: try other shapes, lines, or just collections of points. Do inversions preserve anything geometrically meaningful?