Clearly, there’s no such thing as a “reticulated mixture model” but if you create one I’ll gladly take credit for the name. Instead this post is a demonstration of using mixture models for clustering and the interplay of R and Python via RStudio’s reticulate package.
Mixture Model Basics
The idea behind mixture models is that you have data containing information from two (or more) subgroups and you want to uncover structure of the subgroups. A classic example is you have a bunch of people’s height data and you would like to figure out which are likely to be from men and which are from women. If the data set is labeled with gender the problem is trivial, but if it’s not then it seems reasonable to think we’re looking at data sampled from 2 different normal distributions and we would like to use our data to get an idea what those distributions are. Of course, there’s no reason why we need to limit to only 2 groups or normal distributions, but we will here so we don’t overcomplicate the process.
Our Data
So show the mixture model process, I’m going to manufacture some data out of two bi-variate normal distributions, and I them to have different covariance matrices.
library(mvtnorm) #gets rmvnorm function

#function to make random covariance matrices
randCov <- function(n=2, k=1){
  mat <- matrix(runif(n^2)*k, ncol=n)
  return(t(mat)%*%mat) #make mat symmetric and return
}

cv1 <- randCov(2,2.5)
cv2 <- randCov(2,1.25)
A <- rmvnorm(100, mean=c(20,75), sigma = cv1)
B <- rmvnorm(100, mean=c(18,69), sigma = cv2)
df <- rbind.data.frame(as.data.frame(A), as.data.frame(B))
df$V3 <- c(rep("A",100),rep("B",100))
Here I’ve labeled the data so we can check how our mixture model performed. Let’s look at our data with and with-out using the labels:
library(ggplot2)
library(patchwork)
gNoLab <- ggplot(df, aes(x=V1, y=V2))+geom_point()+ggtitle("No Labels")
gLab <- ggplot(df, aes(x=V1, y=V2, col=V3))+geom_point()+ggtitle("True Labels")

gNoLab+gLab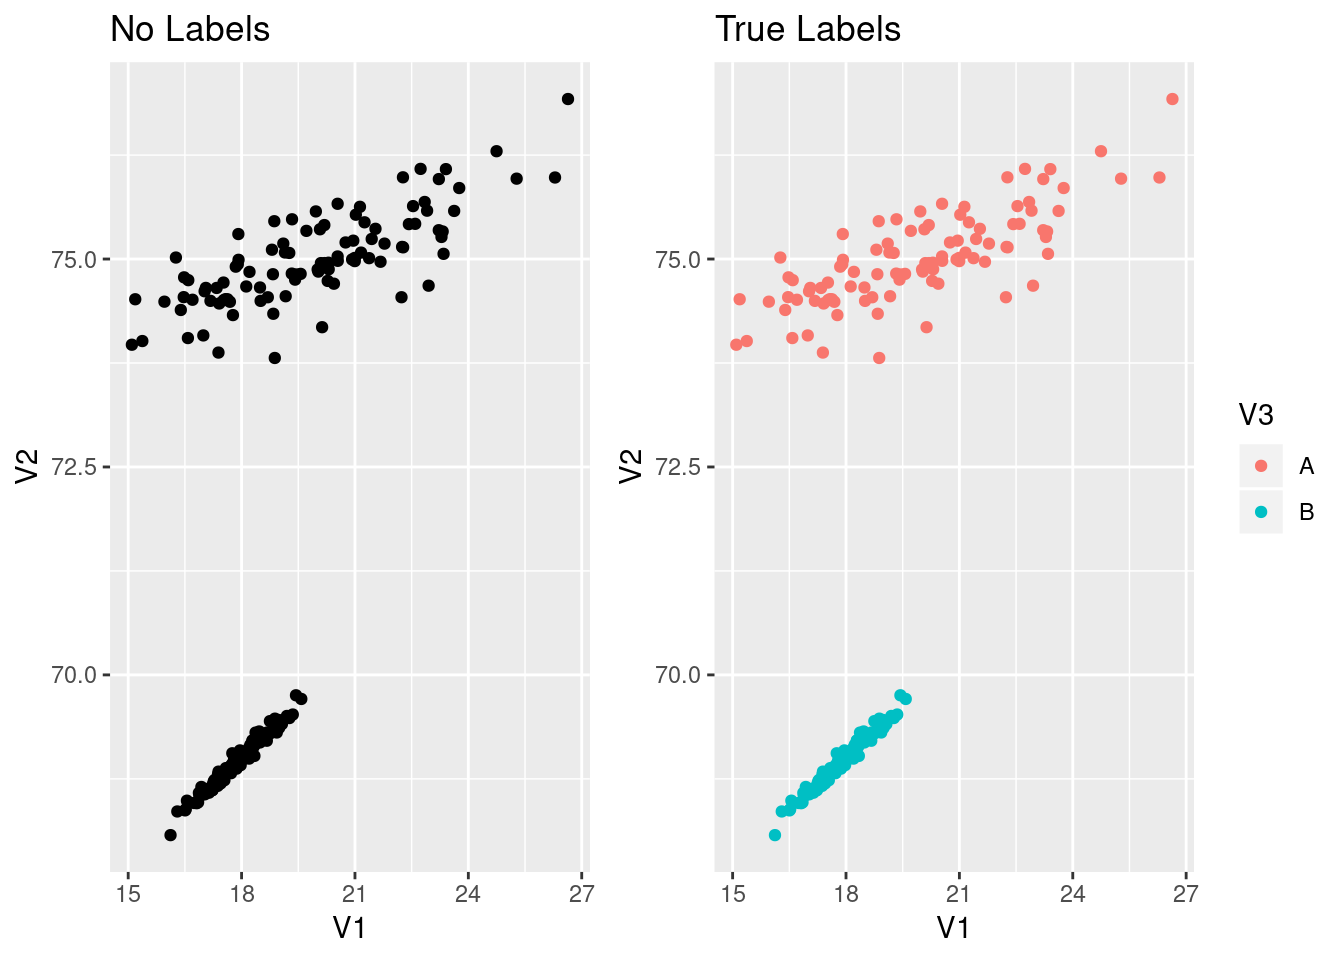
Now our goal will be to recover the labels is we start with the data in the left graph.
Passing Data to Python
R has the functionality to build a gaussian mixture model, but I’ve been working with python some and want to use reticulate’s ability to pass data and results between R and python. First, let’s get R ready:
library(reticulate)
use_python("/usr/bin/python") # I'm using python 3.7.1 in Arch linux
Now in a python code chunk, we can access R objects.
import numpy as np
import pandas as pd
print(r.df.head())
## V1 V2 V3
## 0 22.593247 75.423297 A
## 1 20.012685 74.874178 A
## 2 20.074491 75.357672 A
## 3 20.541347 75.030955 A
## 4 24.746648 76.296463 AMixture Model in Python
Now that we can get our data from R into python, we’ll use SciKit Learn to build a Gaussian Mixture model. We’ll need to give two parameters, the number of components we think the mixture has and a parameter about how the covariances may vary. We also have to copy the dataframe from R into a pandas dataframe so we can add a new column.
from sklearn.mixture import GaussianMixture
gmm = GaussianMixture(n_components=2, covariance_type='full')
pydf = r.df
pydf['gml']=gmm.fit_predict(pydf[['V1','V2']])
print(pydf.head())
## V1 V2 V3 gml
## 0 22.593247 75.423297 A 1
## 1 20.012685 74.874178 A 1
## 2 20.074491 75.357672 A 1
## 3 20.541347 75.030955 A 1
## 4 24.746648 76.296463 A 1Check Results
We can take advantage of ggplot2 to visualize the mixture model labels now. I’ll reproduce the graph above, but now the left side will be colored by the labels from the mixture model while the right is still colored with the true labels.
py$pydf$gml <- ifelse(py$pydf$gml==0, "A","B")
gMMLab <- ggplot(py$pydf, aes(x=V1, y=V2, col=gml))+geom_point()+ggtitle("Labeled by GMM")

gMMLab+gLab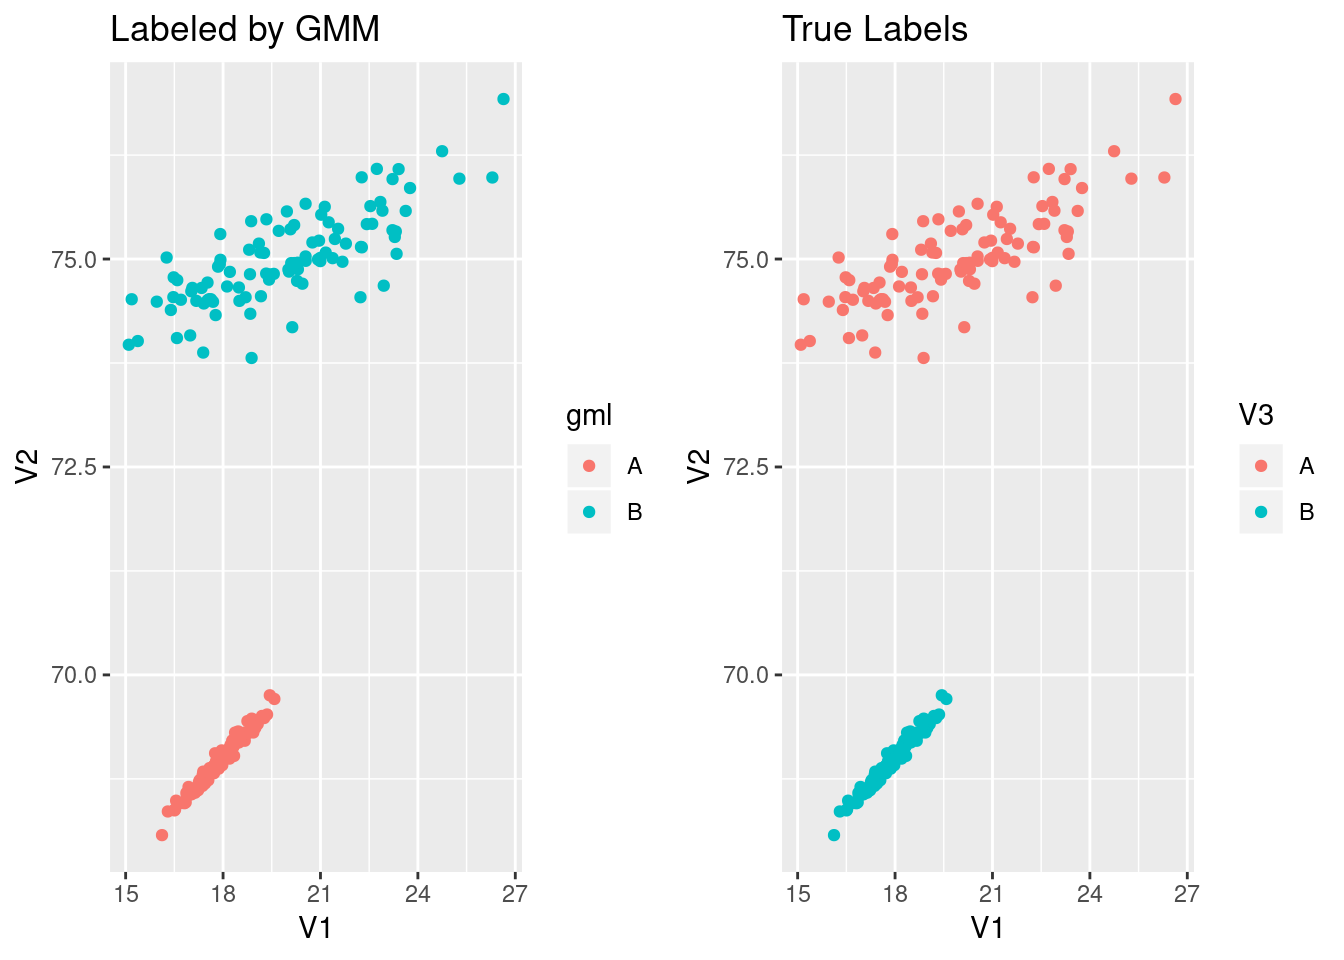
That looks pretty successful! Obviously, the more mixed the data is, the hard it is for the mixture model to correctly identify the boundary. Also, if we have the wrong number of mixture components, the model labels will muddle the components. Sklearn provides a BayesianGaussianMixture that can identify less than the provided number of components. Perhaps that can be a post in the near future.