I’ve done some analysis of my gps running data before, but mostly just some mapping. I’ve always wanted to bring in some more sophisticated analysis such as identifying runs with similar geographic features (e.g. track workouts) or identifying, categorizing, and comparing hills. To really get into either of these things, I first needed good elevation data which isn’t provided by my forerunner 220. In this post I’ll show some of the problems with the elevation data coming from my garmin 220, how to get elevation data from the RaceMap API (and compare a few other elevation api’s), and then examine how good the new elevation data is.
First, let’s load the running data and standard libraries.
import numpy as np
import pandas as pd
import matplotlib.pyplot as plt
import seaborn as sns

pts = pd.read_csv('../../static/files/points.csv')
pts.info()
## <class 'pandas.core.frame.DataFrame'>
## RangeIndex: 60920 entries, 0 to 60919
## Data columns (total 8 columns):
## Unnamed: 0 60920 non-null int64
## @lat 60920 non-null float64
## @lon 60920 non-null float64
## ele 60920 non-null float64
## time 60920 non-null object
## speed 60920 non-null float64
## pointID 60920 non-null int64
## runID 60920 non-null object
## dtypes: float64(4), int64(2), object(2)
## memory usage: 3.7+ MBForerunner Elevation Issues
When I first looked into the elevation data off my garmin, two big issues jumped out and made me question how reliable it was:
- ‘fake’ hills - large (30 to 60 meter) drops and returns to elevation over a less than a minute.
- disconnected loops - the start and end elevation of runs being dramatically off (20+ meters).
There is also a lot of general noise and at low elevation (near sea level) it often appears that I’m under water. Here are a few examples.
76O81129
This run took place in Boise, and over a fairly flat area. Here’s the elevation profile and a lon/lat plot.
sevensix = pts[pts['runID']=='76O81129']
fig, ax = plt.subplots(1,2)
sevensix.plot('pointID', 'ele', ax=ax[0])
ax[0].set_title('Elevation Profile 76O81129')
ax[0].set_ylabel('Elevation (m)')
sevensix.plot('@lon', '@lat', ax=ax[1], legend=False)
ax[1].set_title('Lon/Lat Map 76O81129')
plt.tight_layout()
plt.show()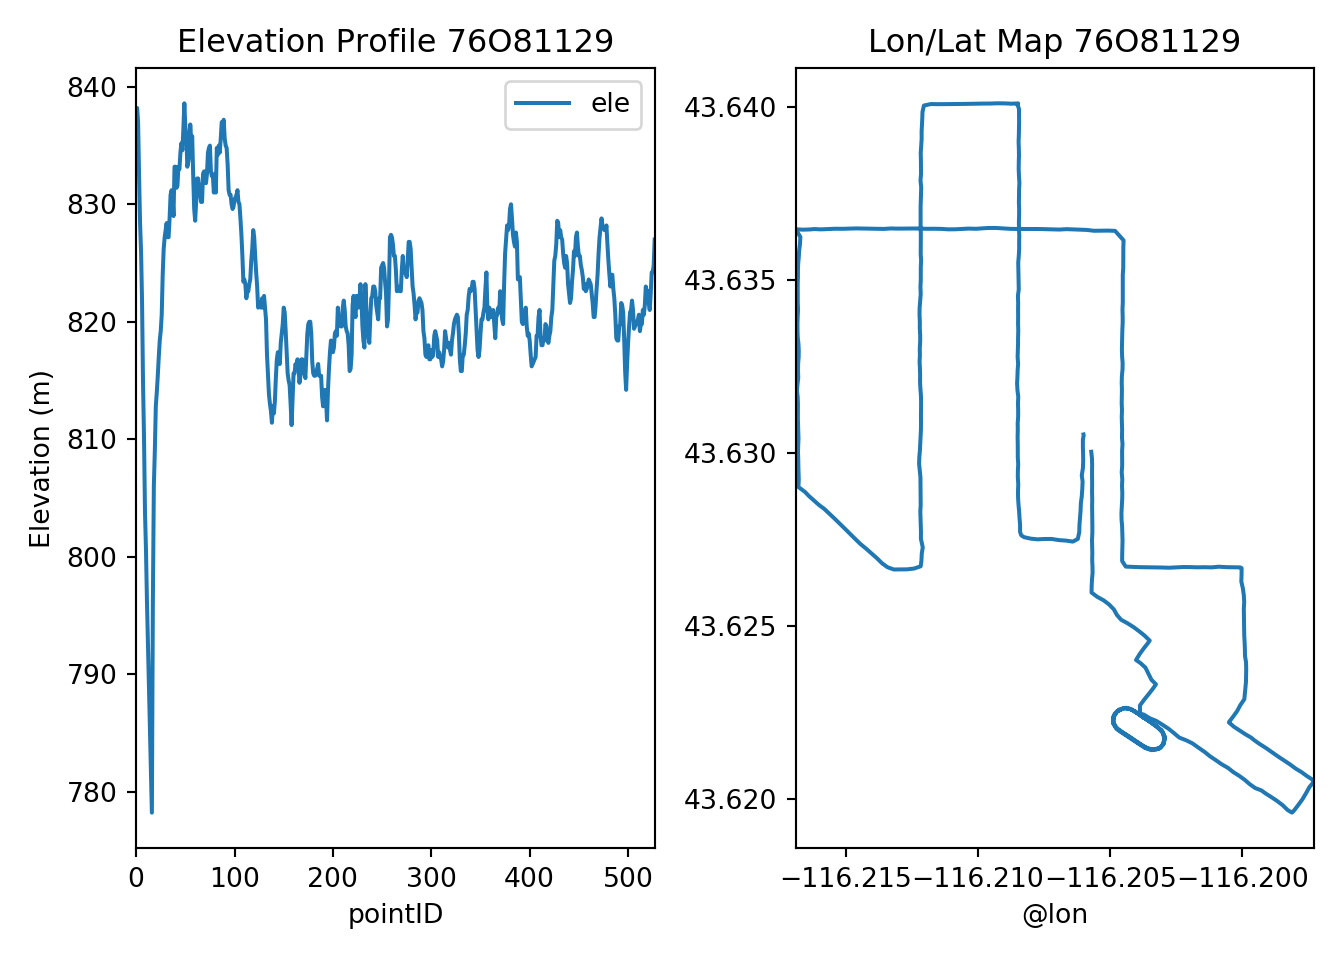 The start of the elevation profile shows the ‘fake hill’ type of problem of approximately 50 meters! Furthermore, the map clearly shows what appears to be a track (see the oval?) but the elevation profile fails to show a long nearly flat segment.
638B2312
This run was an out and back along the beach in the Outer Banks. This is very flat near the shoreline. Here’s the elevation profile and a lon/lat plot.
sixthree = pts[pts['runID']=='638B2312']
fig, ax = plt.subplots(1,2)
sixthree.plot('pointID', 'ele', ax=ax[0])
ax[0].set_title('Elevation Profile 638B2312')
ax[0].set_ylabel('Elevation (m)')
sixthree.plot('@lon', '@lat', ax=ax[1], legend=False)
ax[1].set_title('Lon/Lat Map 638B2312')
plt.tight_layout()
plt.show()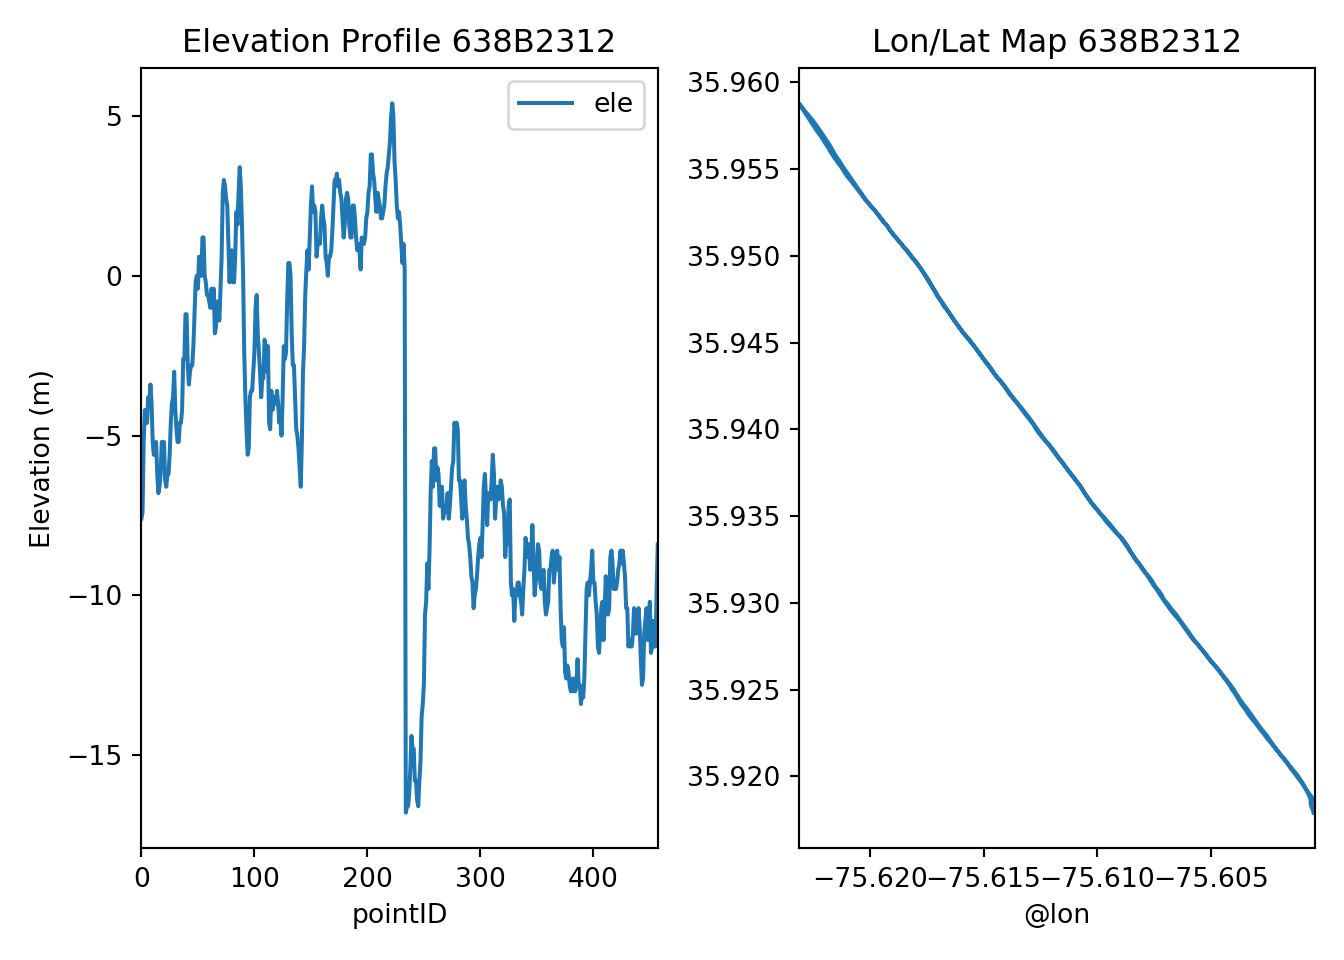 The mean elevation of the first 5 points is \(-5.8\) meters, while the last 5 points is \(-10.9\) meters. So we ended 5 meters lower than we started. The garmin records data at 6 second intervals, so these are two 30 second average elevations. In reality the elevation wasn’t changing and I was at sea level, both values should be nearly 0 with much less variation then we’re seeing.
Elevation API’s to the Rescue
Some time ago, I had heard the Google maps had an elevation api that would give you the elevation of a given lat/lon pair. This seemed like a good way to get reliable elevation data, however Google’s elevation api is no longer free. So I began looking for a replacement, which is apparently a popular thing. I found a number of possibilities, with the two most promising being elevation-api.io and racemap.
Elevation-api.io is simple, but to get the resolution I needed it would have cost money. The costs are low, and I could have gotten elevations for all my points for a few dollars at most, but I wanted to find a free version if possible. If nothing free could be found, this is what I would use though.
Racemap came through with a free api at good resolution. Like elevation-api.io, it works with simple get or post queries from json arrays of latitude and longitude. After a little experimentation, I wrote the following script
import numpy as np
import pandas as pd
import requests

def get_good_elevation(run_id):
    rmurl = 'https://elevation.racemap.com/api'
    runll = pts[pts['runID']==run_id][['@lat','@lon']].to_json(orient='values')
    post_resp = requests.post(url=rmurl, data=runll)

    return(post_resp.json())


if __name__ == '__main__':
    pts = pd.read_csv('data/points.csv')
    elevDF = pd.DataFrame(columns=['runID', 'pointID', 'RMelev'])
    for rid in pts.runID.unique():
        runDF = pts[pts['runID']==rid][['runID','pointID']]
        runDF['RMelev'] = get_good_elevation(rid)
        elevDF = pd.concat([elevDF, runDF], axis=0)

    elevDF.to_csv('data/pt-elevation.csv')
It’s pretty self explanatory, with the only interesting thing being pandas .to_json(orient='values'). This dataframe method converts the dataframe to a json object. The values orientation makes the object an array of arrays, where each inner array is a row of the dataframe. That is, it converts the latitude and longitude columns into an array of points. Everything else is just subsetting, making the post request, merging results together. I’m making the post request for each run because there’s a payload limit of around 10,000 points and I have 60,000. Making the code work for a single run seemed to be the most modular approach, but I could do it in far fewer requests.
Great Elevation?
At this point, we’ve seen problems in the Garmin data and found free data online that fixes the problem. Well, let’s not be too quick to trust everything we find on the internet.
Here are the two earlier runs, but not with the racemap elevation in the elevation profile:
elev = pd.read_csv('../../static/files/pt-elevation.csv')
ptelev = pd.merge(pts, elev, how='inner', on=['runID', 'pointID'])

sevensix = ptelev[ptelev['runID']=='76O81129']
fig, ax = plt.subplots(1,2)
sevensix.plot('pointID', ['ele', 'RMelev'], ax=ax[0])
ax[0].set_title('Elevation Profile 76O81129')
ax[0].set_ylabel('Elevation (m)')
sevensix.plot('@lon', '@lat', ax=ax[1], legend=False)
ax[1].set_title('Lon/Lat Map 76O81129')
plt.tight_layout()
plt.show()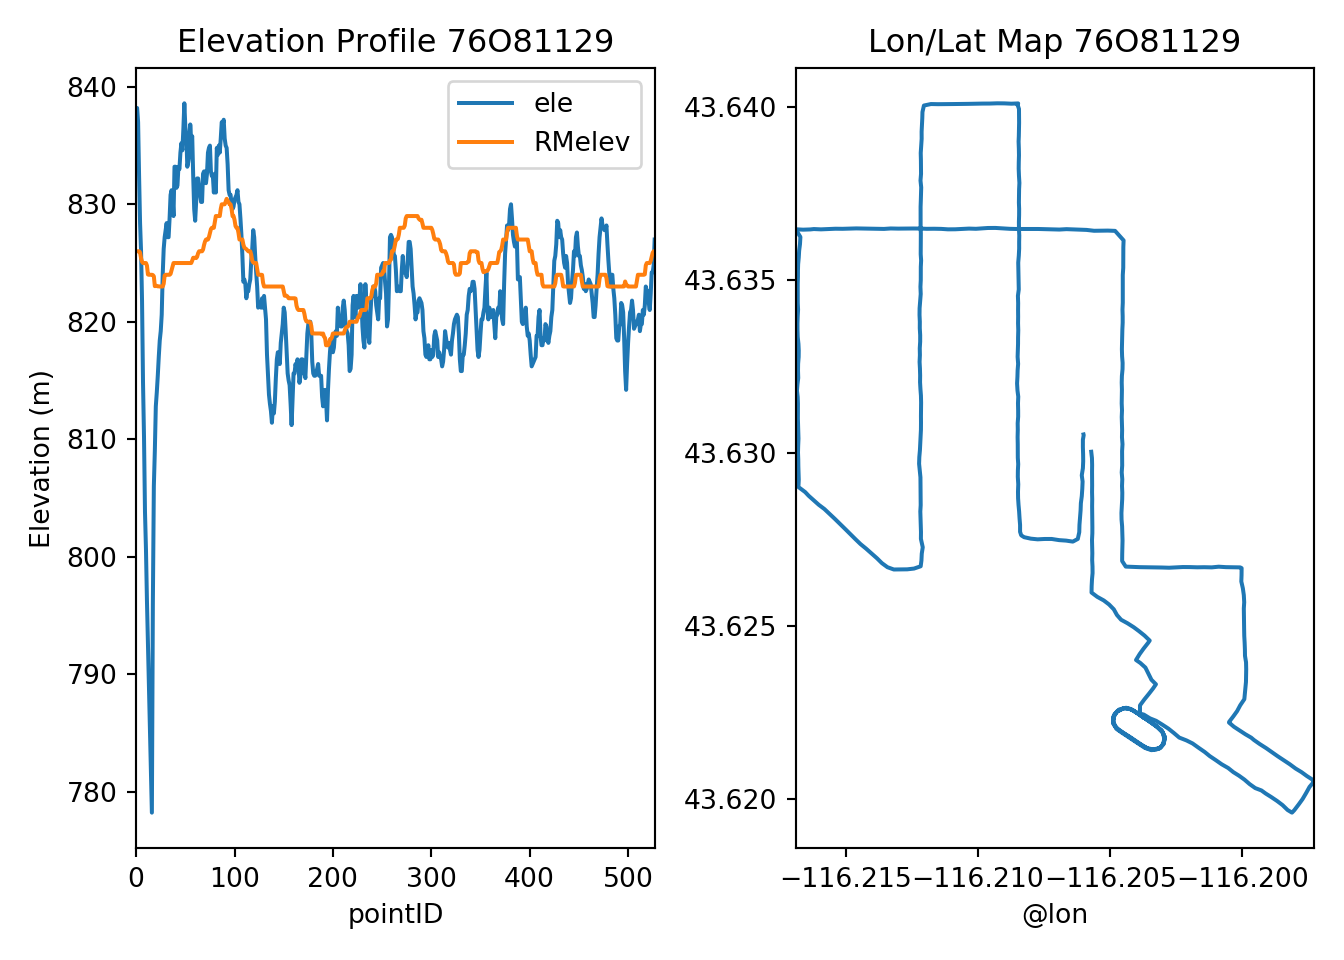
sixthree = ptelev[ptelev['runID']=='638B2312']
fig, ax = plt.subplots(1,2)
sixthree.plot('pointID', ['ele', 'RMelev'], ax=ax[0])
ax[0].set_title('Elevation Profile 638B2312')
ax[0].set_ylabel('Elevation (m)')
sixthree.plot('@lon', '@lat', ax=ax[1], legend=False)
ax[1].set_title('Lon/Lat Map 638B2312')
plt.tight_layout()
plt.show()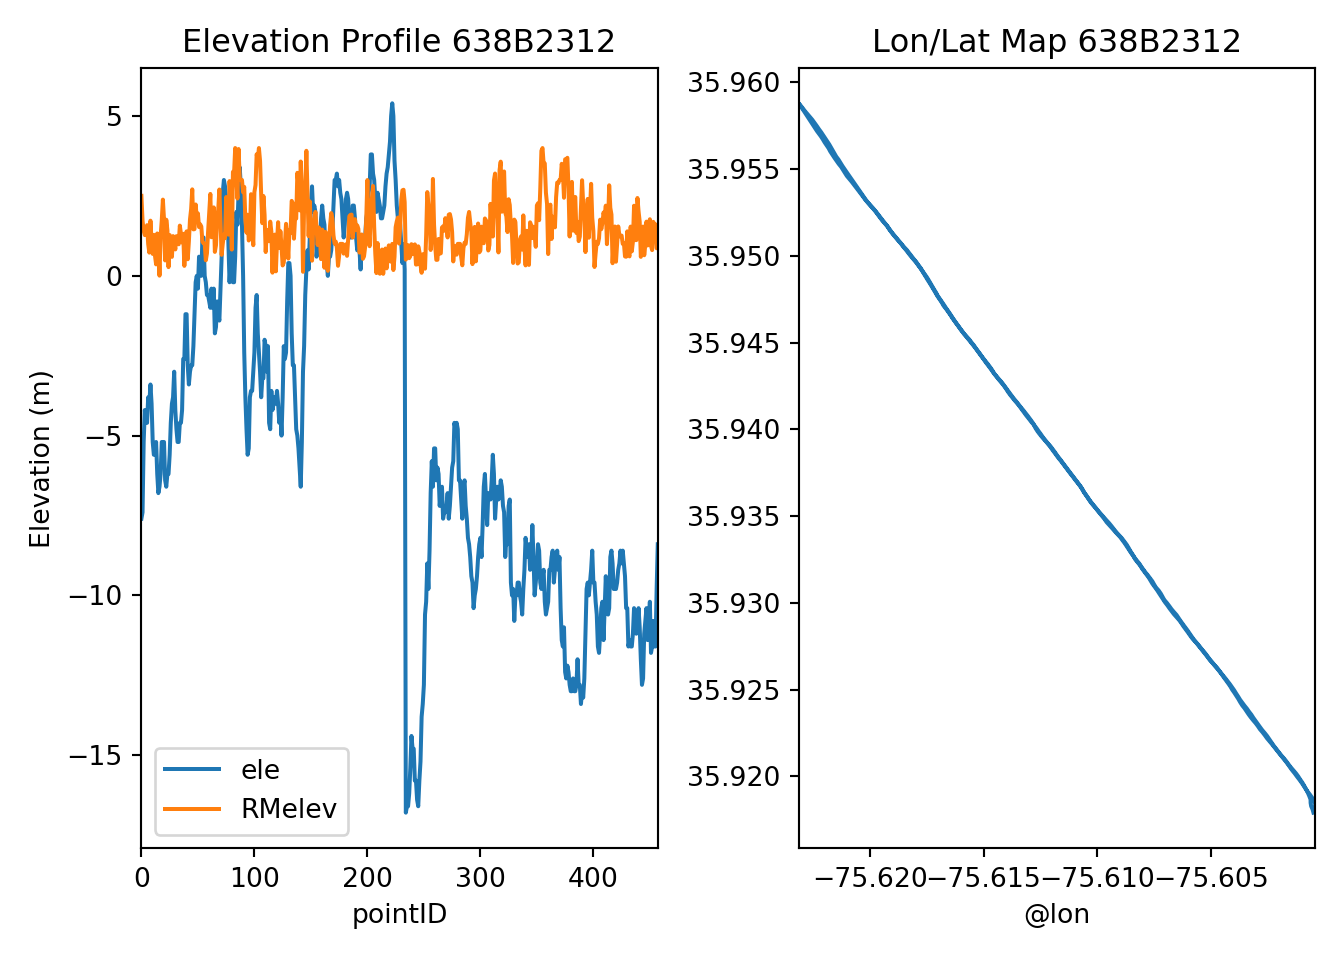
Both seem to be substantial improvements: no crazy hills, no running under water, and in the first it even looks like there’s a track towards the end!
Looking at the elevation profiles for all runs, most get smoothed out with obvious problems fixed by the racemap elevation data. However, some runs have clear anomalies or look like totally different runs.
For example, run 63L63409 seems like the two sets of elevation data correspond to almost completely different paths:
sixL = ptelev[ptelev['runID']=='63L63409']
fig, ax = plt.subplots(1,2)
sixL.plot('pointID', ['ele', 'RMelev'], ax=ax[0])
ax[0].set_title('Elevation Profile 63L63409')
ax[0].set_ylabel('Elevation (m)')
sixL.plot('@lon', '@lat', ax=ax[1], legend=False)
ax[1].set_title('Lon/Lat Map 63L63409')
plt.tight_layout()
plt.show()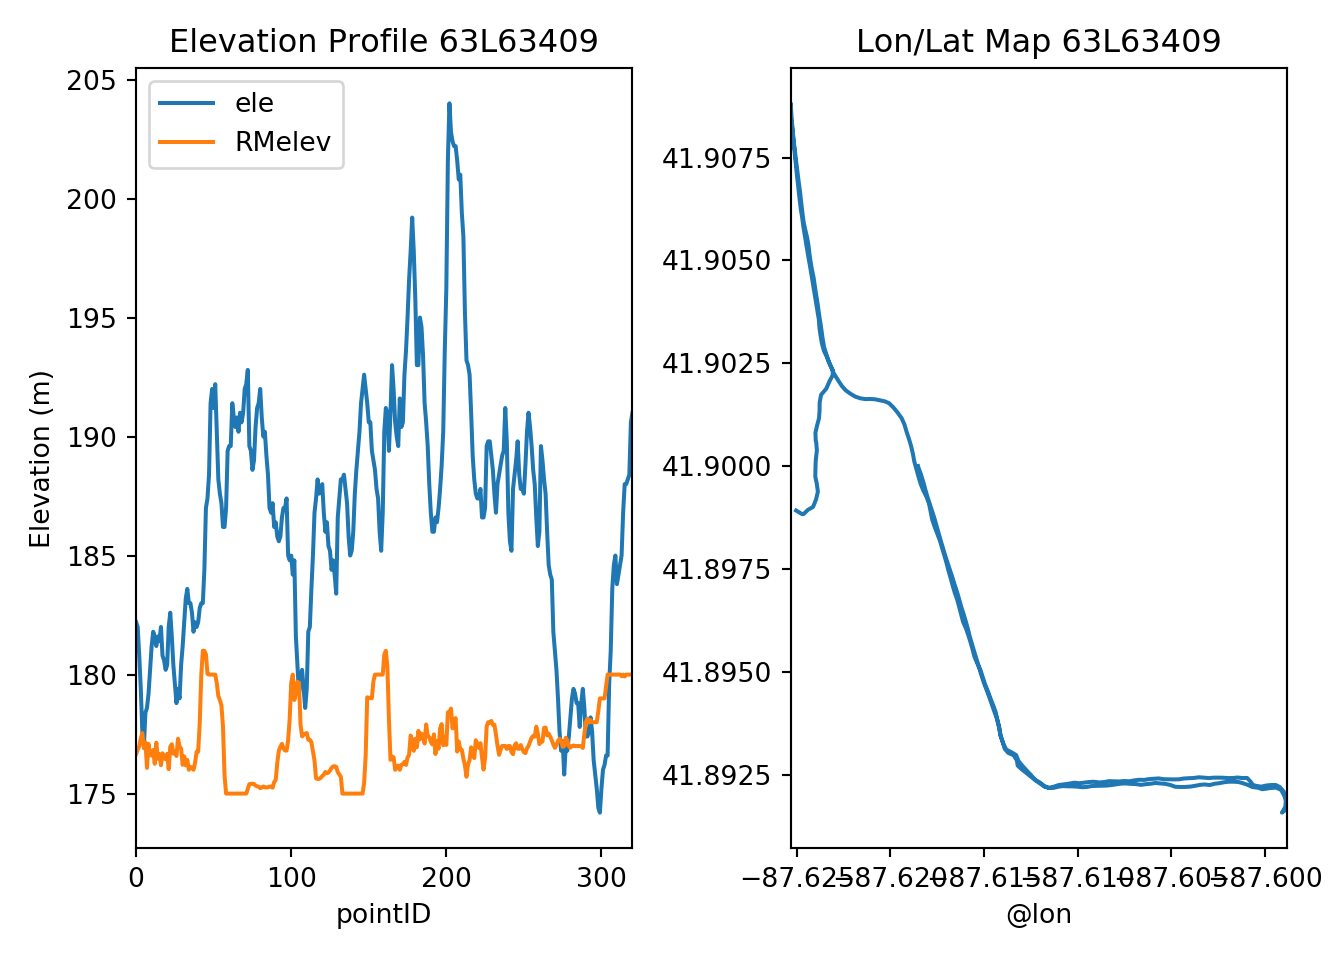 This is a run from Chicago while I was at a conference. It’s mostly along the Lake Front trail (flat) with the horizontal stretch being the Navy Pier. Even the big differences seem to support the racemap data.
Another example, run 53GB3110 has the largest average absolute difference between the garmin and racemap elevation data. Looking at the map and profile, it’s clear why (but only if you know Tacoma geography like I do!):
fivethree = ptelev[ptelev['runID']=='53GB3110']
fig, ax = plt.subplots(1,2)
fivethree.plot('pointID', ['ele', 'RMelev'], ax=ax[0])
ax[0].set_title('Elevation Profile 53GB3110')
ax[0].set_ylabel('Elevation (m)')
fivethree.plot('@lon', '@lat', ax=ax[1], legend=False)
ax[1].set_title('Lon/Lat Map 53GB3110')
plt.tight_layout()
plt.show()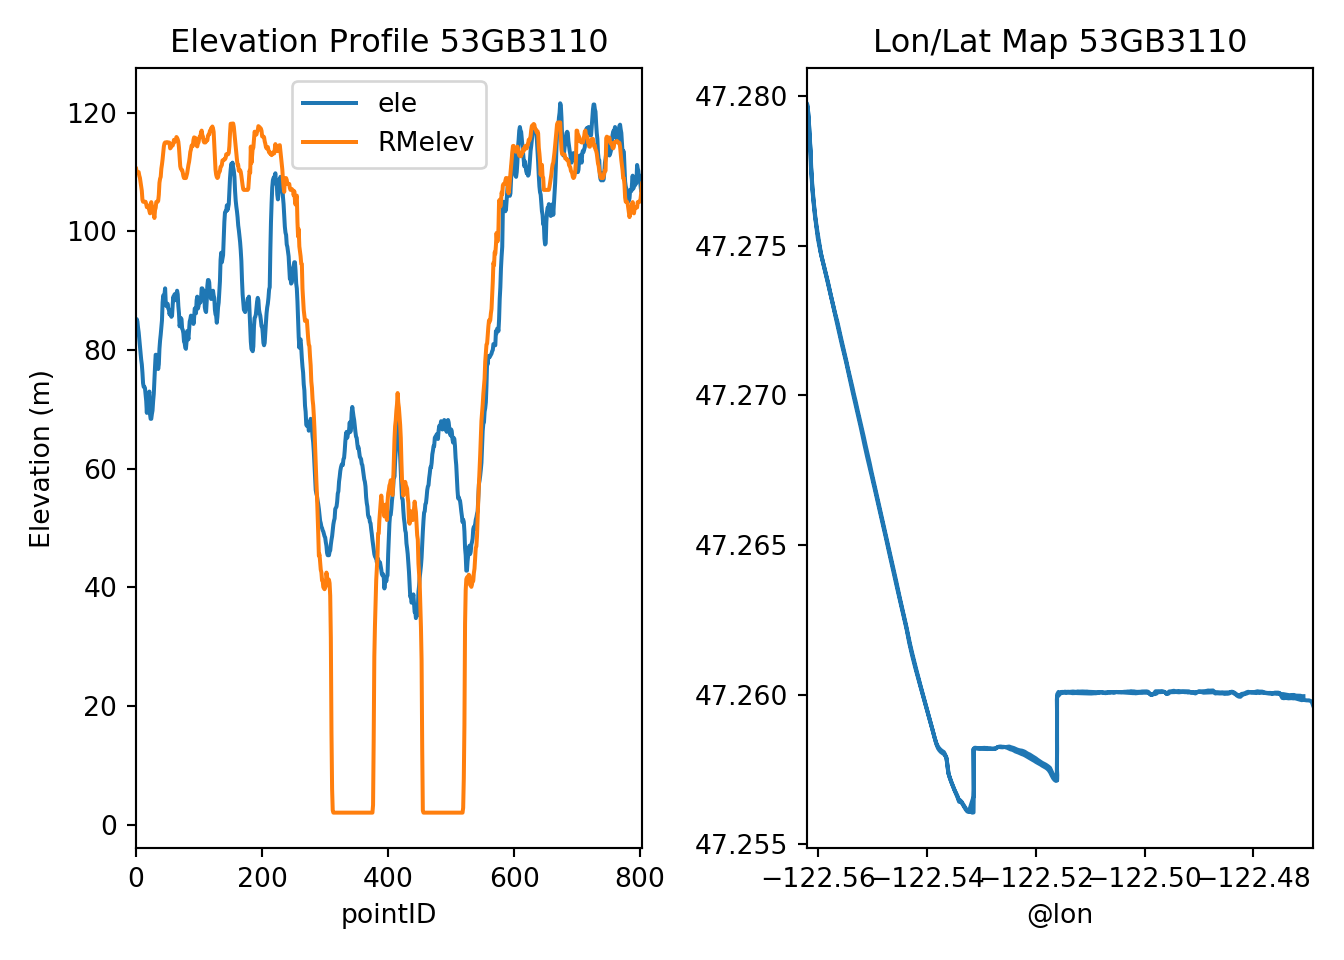 The huge differences where racemap flattens to 0 elevation is the Tacoma Narrows Bridge. While racemap fixes the beginning of the run nicely, and smooths everything, the garmin is given a better measurement of the elevation while on the bridge. This possess a big challenge going forward - usually the racemap elevation is best, but at least sometimes I’ll need the original garmin. Can we make a smart system that knows when to use each? That’s one goal of
 Runalytics.